The results of both reflectometers and ellipsometers are products of fitting, and fitting software will always hand you a number. That is exactly where the danger lies: the number may have converged beautifully yet be physically wrong. "Converged but wrong" is the class of result optical metrology users most need to learn to recognize, and this article offers a workable interpretation method.
First, set the right expectation: fitting software does not "find the true value"; it finds "the set of parameters within the model space you specified that brings the computed spectrum closest to the measured one." Result quality is therefore decided by two things: data quality (whether the spectrum itself is correct) and model quality (whether the model space contains the truth). The software's feedback on the former is goodness of fit (GoF) and residuals; on the latter it has no direct feedback at all — it does not know your model is wrong, and that is precisely the danger.
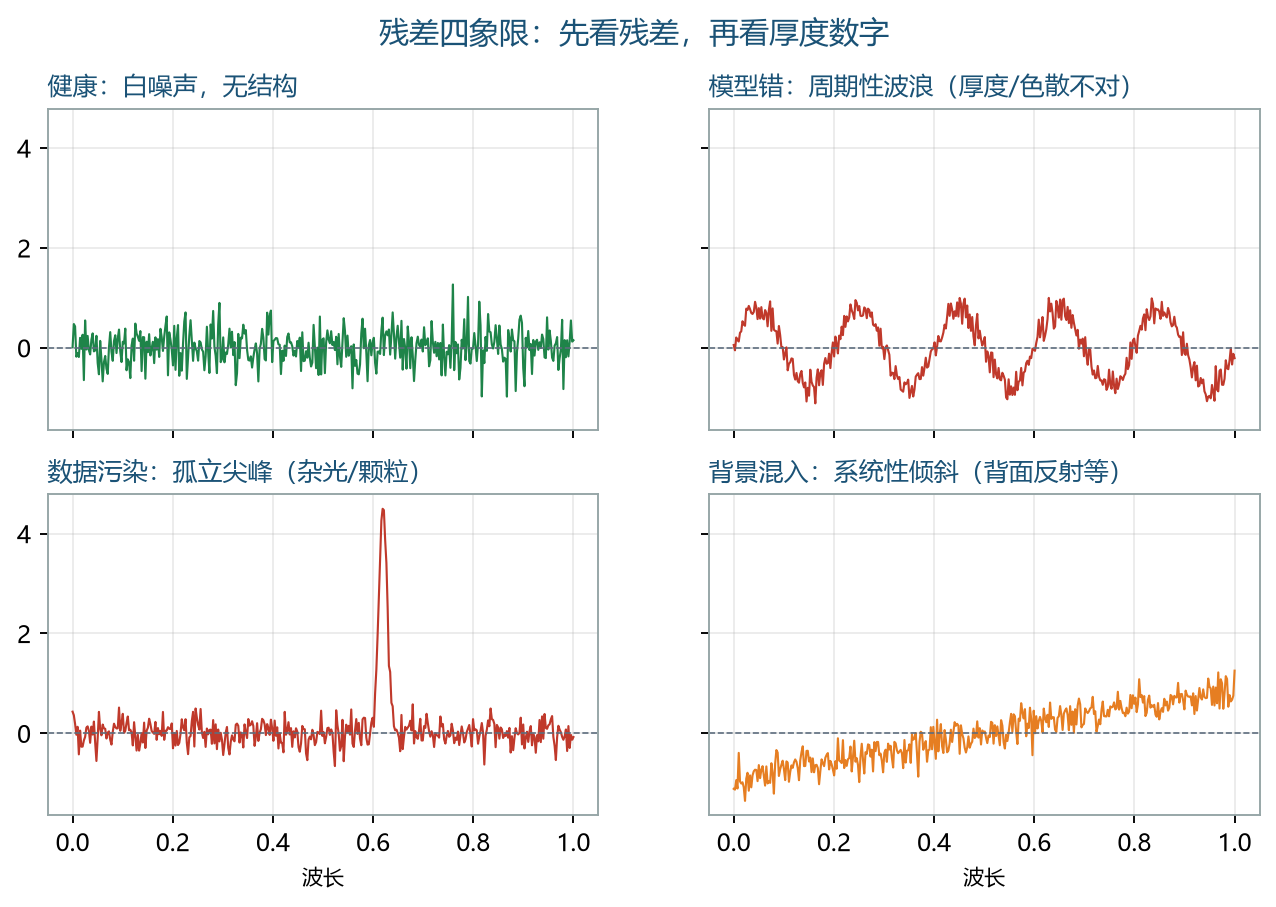
Residuals are the first criterion. After fitting, pull up the residual curve — "measured spectrum minus fitted spectrum" — and look at it. A healthy residual is white noise: random jitter around the zero line, no structure. Unhealthy residuals have recognizable looks: regular waves (periodic deviation across the band, usually meaning the thickness or dispersion model is wrong); isolated spikes (a local wavelength region is contaminated — check stray light or sample defects); systematic tilt (intensity response or substrate signal mixed in — think backside reflection). If the residual shows structure, hold off on using the thickness number.
Parameter correlation is the second criterion. Good fitting software outputs a parameter correlation matrix. Focus on the correlation coefficient between n and d: if its absolute value approaches 1, this pair of parameters is mathematically inseparable (a typical symptom of single-wavelength measurement or too narrow a band), and the uncertainty of the thickness reading is far larger than the software's nominal value. The ways out are either to widen the spectral band or to impose a prior constraint on n (for the principle see "The Coupling Between Refractive Index and Thickness").
The third criterion is a sensitivity test. Manually change an initial value by an order of magnitude and re-run the fit, or fix and release a layer's parameters for comparison: if the thickness result drifts widely with the initial value, the solution is not unique and the current film stack exceeds what this model can solve reliably. This trick is especially effective on multilayer films — five minutes exposes a "beautiful but false" convergence.
Solidify the interpretation routine into daily practice with four recommended steps: check whether the GoF value meets the bar (each vendor defines it differently — watch relative values and trends); check the residuals for structure; check the correlation matrix for high-risk couplings; and periodically cross-validate with an independent method (step height, cross-sectioning). Once the routine is familiar, each sample takes under a minute. For complex film stacks or anomalous data, this is where the vendor's application engineer earns their keep — field support from vendors such as Acuitik usually starts directly from residual analysis, and problem localization is faster than fumbling on your own.
One closing sentence on interpretation philosophy: the thickness the software gives is "the model's answer," not "the sample's answer." The responsibility for making the two coincide lies half with the instrument and half with the user's modeling literacy.
About Acuitik
Acuitik specializes in optical precision measurement technology. Its core products are reflectance-based film thickness gauges, ellipsometers, and OEM film thickness sensors featuring "non-contact, non-destructive, sub-nanometer accuracy":
- Industrial film thickness measurement NS series: NS-20 manual, NS-30 automated Mapping, NS-Micro microscopic, NS-Touch curved-surface, NS-HR thick-film, NS-100 high-speed line-scan
- Research-grade measurement ES series: ES-Tenso ellipsometer, ES-Primo multi-wavelength ellipsometer (for ultrathin films and complex multilayers), plus the NS-Vista dual-channel and NS-Flex portable multimodal units
- OEM film thickness sensors: multi-point nanoscale film thickness, NS-HR thick-film, and NS-Micro microscopic sensor modules, supporting Modbus / OPC UA for integration with PLC and MES, with an SDK provided
The instruments are metrologically certified by the National Institute of Metrology of China and the Shanghai Institute of Measurement and Testing Technology, and Acuitik participated in drafting the group standard T/CIET 2298-2026 "Calibration Specification for Thin-Film Interference Film Thickness Measurement Systems". For more selection guides and application notes, please visit the Acuitik official website.