Foreword: Standing at the Forefront of AI Compute
In the compute race ignited by artificial intelligence (AI), data centers demand near-ruthless bandwidth and power efficiency. Thin-film lithium niobate (TFLN), with its extremely high electro-optic coefficient, low insertion loss, and miniaturization advantages, has become a key path to realizing 800G and even 1.6T optical modules, earning it the title of "the silicon of photonics."
However, to tame this material, the first step in mass production is to measure its film thickness precisely. Because of its natural "birefringence," conventional measurement methods often "crash and burn" right here. Today, we take a deep dive into the physical logic behind thin-film lithium niobate metrology.
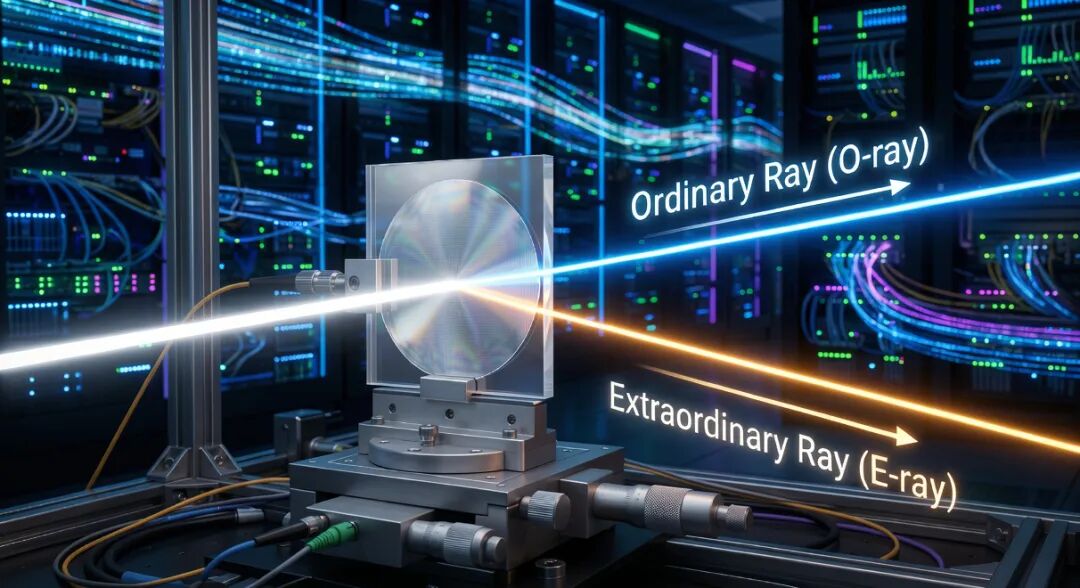
1. The Physical Foundation: e-Light and o-Light, "Together but Dreaming Differently"
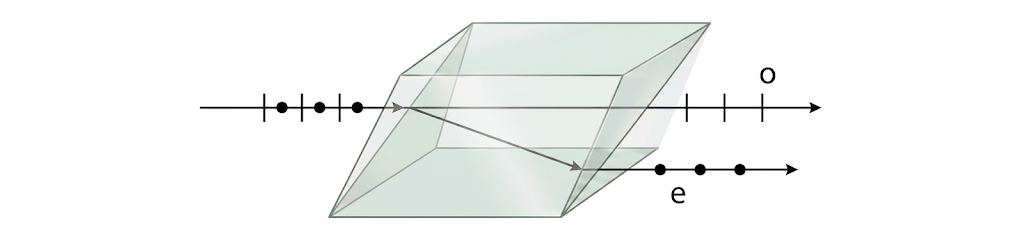
Lithium niobate (LiNbO₃) is a typical uniaxial crystal. This means that once light enters this material, its fate is decided by its "polarization direction":
- o-light (ordinary ray): its refractive index n_o is the same in every in-plane direction — it behaves like the well-behaved, rule-following type.
- e-light (extraordinary ray): its refractive index n_e varies with direction. For lithium niobate, a negative uniaxial crystal, n_e is markedly smaller than n_o (at a wavelength of 633 nm, the difference Δn between the two is about 0.08).
Why Is It "Hard to Measure" Accurately?
In optical measurement, thickness (d) and refractive index (n) are a pair of strongly coupled variables. If the model chooses the wrong refractive index (for example, mistakenly using a single-index model when measuring an x-cut sample), the computed thickness can be off by as much as more than 20 nm. For photonic devices that demand nanometer-level accuracy, this is fatal.
2. In Practice: The Measurement Logic for x-Cut and z-Cut
Different cuts of lithium niobate behave completely differently under a reflectance-based film thickness gauge:
- z-cut (optic axis perpendicular to the surface): at normal incidence, the light wave "sees" only n_o. This is "easy mode" — as long as the refractive index database is accurate, fitting is very straightforward.
- x-cut (optic axis in the film plane): this is "hard mode." Because we use a tungsten-halogen lamp (unpolarized light), the beam contains components both parallel and perpendicular to the optic axis.
3. The Core Technology: Beware the "Mathematical Trap" Behind High GOF
When we use an advanced reflectance-based film thickness gauge to measure an x-cut sample, the signal the sensor receives is not a simple curve, but a linear superposition of the o-polarized interference wave and the e-polarized interference wave.
1. The Fringe Damping Phenomenon
Because of the difference between n_o and n_e, the peak positions of the two sets of interference fringes do not coincide. This degrades the fringe contrast in the spectrum, making it look as if the signal had been "smoothed out."
2. Mathematical Fitting vs. Physical Reality
Here is a pitfall that is extremely easy to overlook: a high GOF (goodness of fit) is not equivalent to an accurate thickness. In our experiments we found that using a pure n_o model, a pure n_e model, or an anisotropic hybrid model can each produce an excellent fitted curve (GOF all > 0.95).
- If only the n_o model is used: the algorithm will compensatively "push down" the thickness in order to match the phase, yielding the false result of 511.45 nm;
- If only the n_e model is used: the thickness will be compensatively "pushed up," yielding the erroneous value of about 531.96 nm.
3. The Anisotropic Superposition Model: Finding the One Truth
Our system establishes a dedicated anisotropic superposition model that no longer forces the search for an "average refractive index," but simultaneously recovers the physical contributions of n_o and n_e. Only with the physical model correct is the resulting 524.69 nm (true thickness: 525 nm) the true physical thickness.
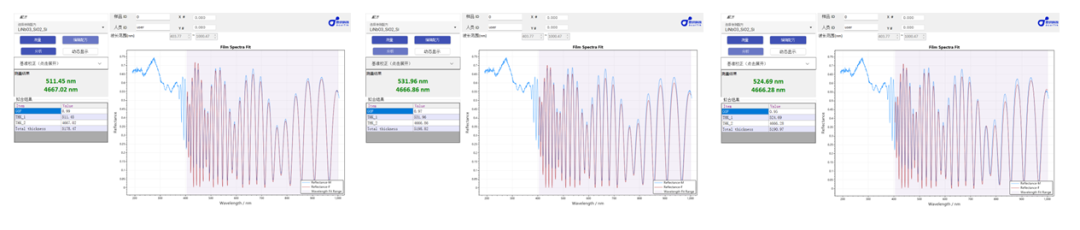
**图3:不同折射率模型下的拟合对比:只有我们的混合模型能解耦nd 补偿效应(左图使用o光**折射率模型,中图使用e**光折射率模型,右图使用我们的算法得到的正确混合模型************)**
4. Industrial-Grade Delivery: Automation and High Efficiency
On the mass-production line for optical communication chips, efficiency is life. To meet high-density Mapping demands, we have introduced several automation technologies:
- Automatic wafer alignment: combined with vacuum chucking and precision positioning, this enables fast scanning of 8-inch wafers.
- Chip marker recognition: for the tiny markers on each chip, algorithms achieve micron-level positioning, ensuring the light spot lands precisely on the test area.
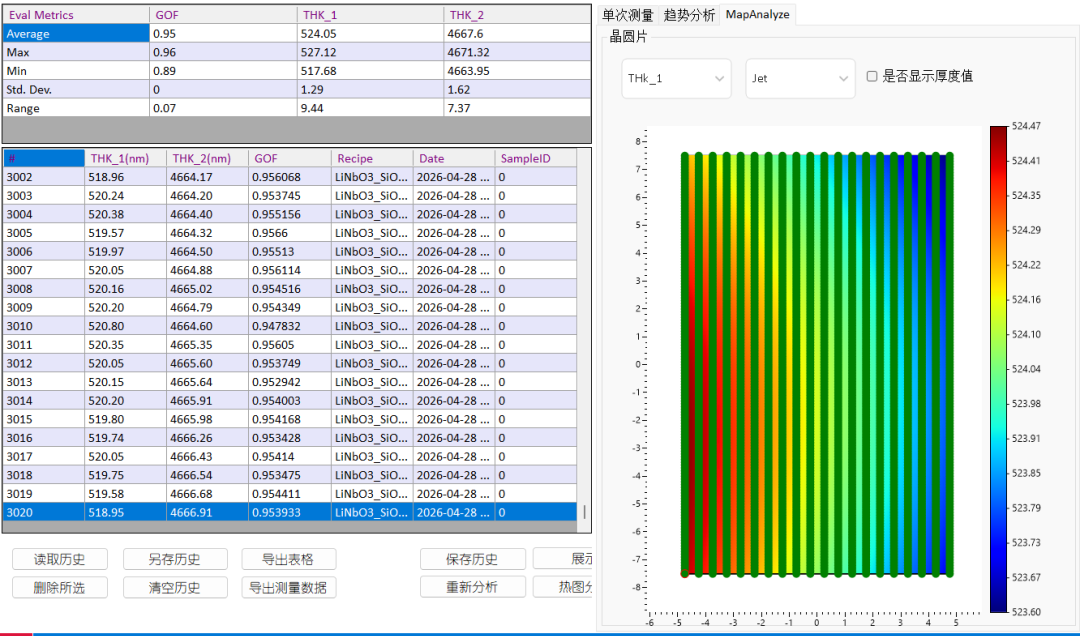
- Ultra-fast measurement: thanks to an optimized parallel fitting algorithm, even the complex anisotropic model takes only about 1 second per point on average. A full-chip scan of 3,020 points can be completed efficiently within a short time.
Closing: In the Future of Optical Interconnect, Precision Is the Only Rule
From 800G to 1.6T, from conventional lithium niobate to thin-film lithium niobate, materials and structures change — but the pursuit of physical truth does not. By deeply understanding the difference between e-light and o-light and building it into highly efficient measurement algorithms, we are not merely measuring thickness; we are safeguarding the deployment of next-generation optical interconnect technology.