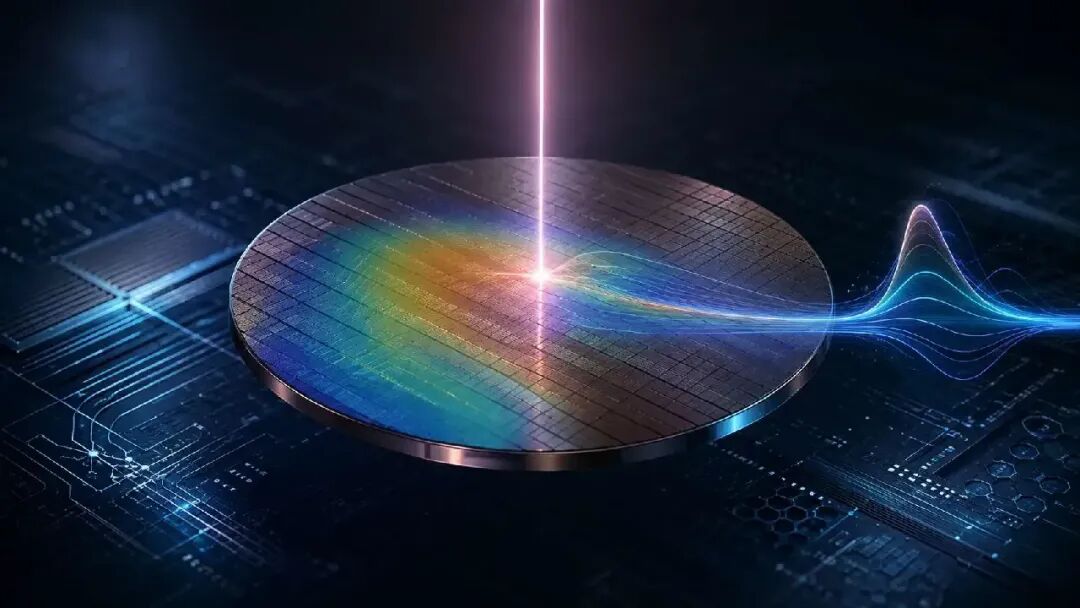
An ordinary-looking InP wafer — what is its actual thickness? Without sectioning or touching the sample, can you get the thickness quickly, and even go further to observe the thickness uniformity across the whole wafer?
The answer: yes.
For compound semiconductor materials like InP (indium phosphide), the spectrum in a suitable wavelength band already "hides" thickness information. Read those spectra correctly, and fast, non-contact thickness measurement becomes possible.
01 | Why InP Thickness Matters
InP is a typical III-V compound semiconductor material with important applications in high-speed electronic devices, optical communication, lasers, and photonic integration.
Unlike ordinary mechanical structural parts, in semiconductor manufacturing wafer thickness is more than a dimensional parameter.
From wafer thinning, grinding, and polishing to subsequent bonding and device processing, thickness and its in-plane uniformity can both reflect the process state.
Therefore, what engineers really care about is often not just:
"How thick is this wafer?"
but also:
"Is the whole wafer uniformly thick?"
"After thinning, is the center thick and the edge thin?"
"Has the process drifted between different batches?"
These are also questions that a single-point thickness value can hardly answer.
02 | How Does Light "See" Thickness Without Cutting the Wafer?
InP has a very interesting property.
It is not completely opaque at all wavelengths.
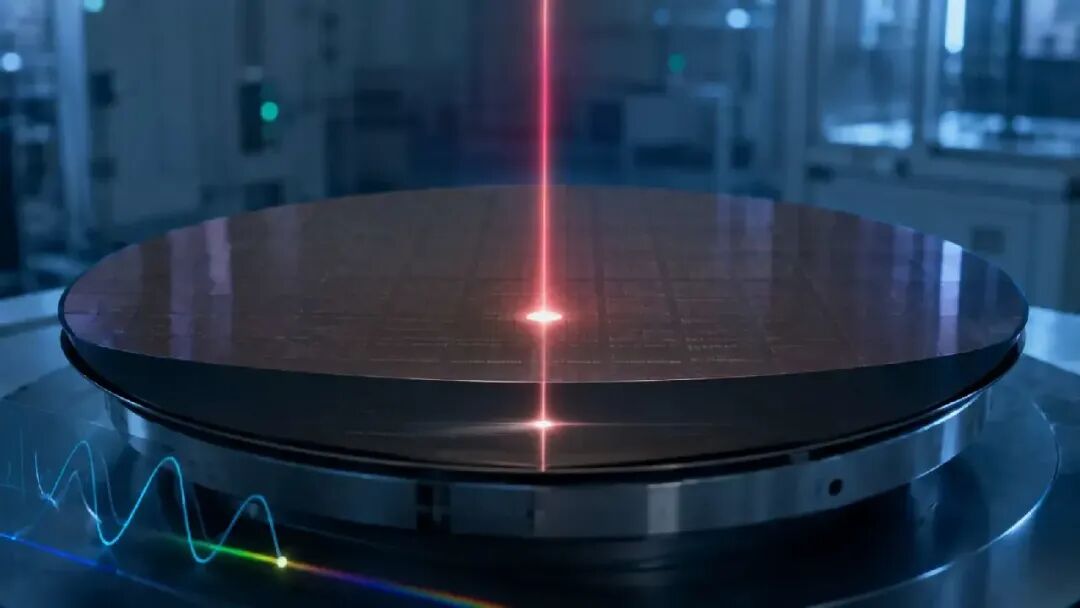
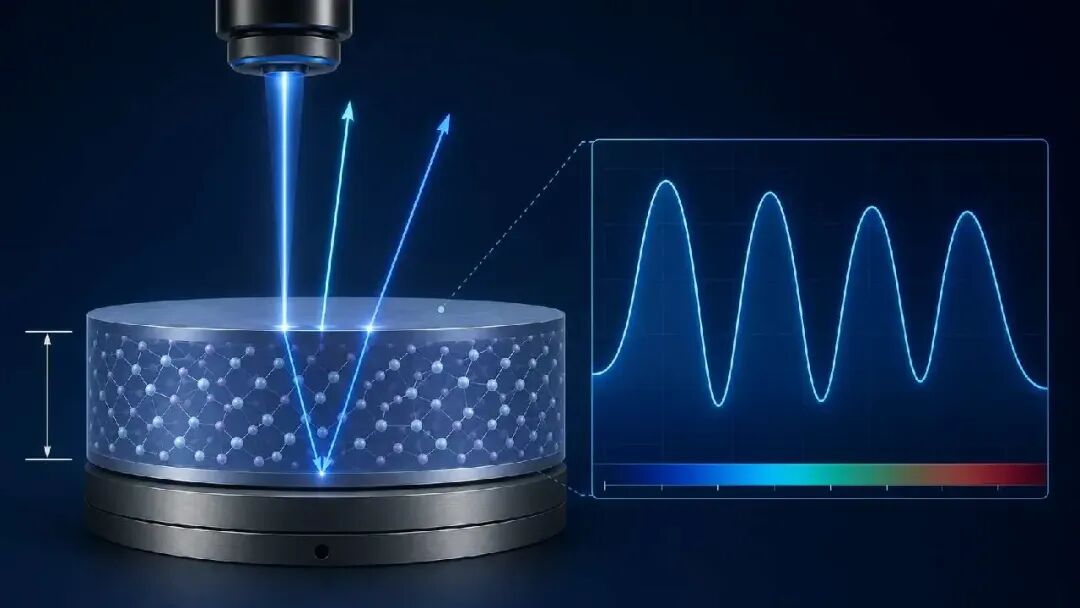
InP's room-temperature bandgap is about 1.344 eV, and its infrared refractive index is about 3.1. With a suitable near-infrared measurement band selected, light can enter the material and reflect from the wafer's top and bottom surfaces respectively.
An incident beam thus becomes at least two parts:
- one part reflects directly from the InP top surface;
- the other part enters the InP and returns after reflecting from the bottom surface.
The two beams travel different distances, producing an optical path difference.
Ultimately, they superpose and form periodic interference peaks and valleys in the spectrum.
And that period is directly related to the wafer thickness.
03 | The Thickness Actually Hides in the "Fringe Spacing"
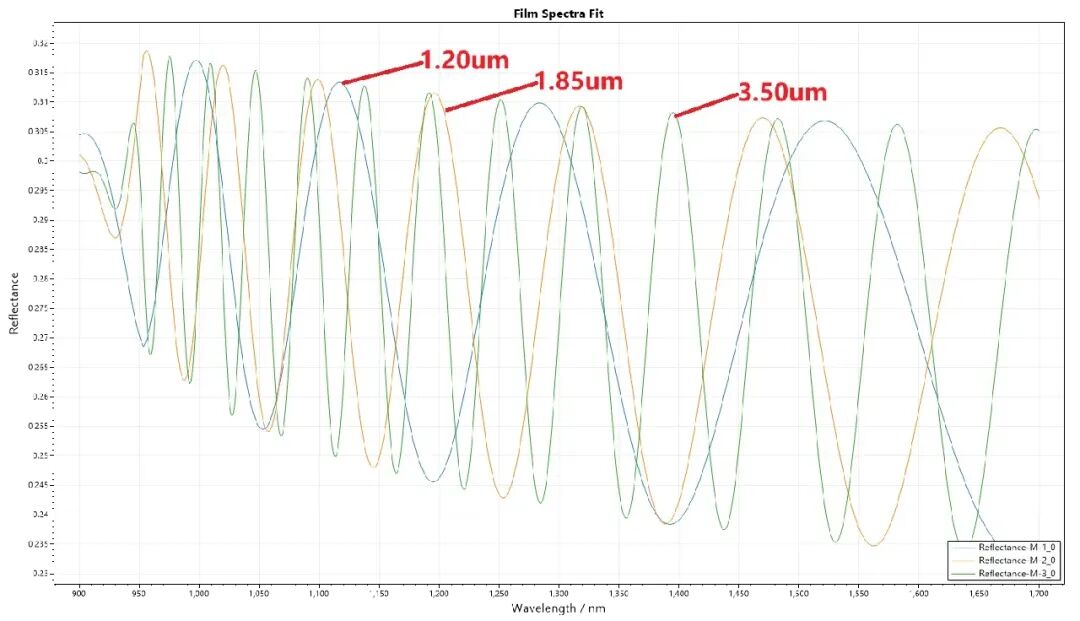
If you spread out the measured reflectance spectrum, you will find it is not a smooth curve, but a series of regularly varying peaks and valleys.
These peaks and valleys are not noise.
They are the "optical fingerprint" left behind by the wafer thickness.
At near-normal incidence, the interference period depends on the material's refractive index (n) and thickness (d). Expressed in wavenumber, it can be understood approximately as:
Δσ ≈ 1 / (2nd)
where:
- n: the refractive index of InP;
- d: the thickness of the InP;
- Δσ: the wavenumber interval between adjacent interference periods.
The relationship is very intuitive:
Thicker wafer → longer optical path → denser interference fringes in the spectrum.
Thinner wafer → shorter optical path → sparser interference fringes in the spectrum.
So what we truly measure is not "distance."
We first measure a spectrum, and then invert the thickness from the spectrum.
04 | Why Not Sectioning or Contact Measurement?
Traditional thickness measurement of course has many methods.
But on the wafer manufacturing floor, the question is often not just "can it be measured," but:
Can it be measured quickly?
Can it be done without damaging the sample?
Can many points be measured?
A destructive cross-section approach requires sample preparation, sectioning, and observation; although it shows the cross-section directly, it is very hard to use for high-volume wafer inspection.
Contact measurement, meanwhile, can be affected by probe pressure, surface condition, and the top/bottom surface references.
The greatest strength of the spectral method is:
Light goes in, a spectrum comes back, and the thickness can be computed.
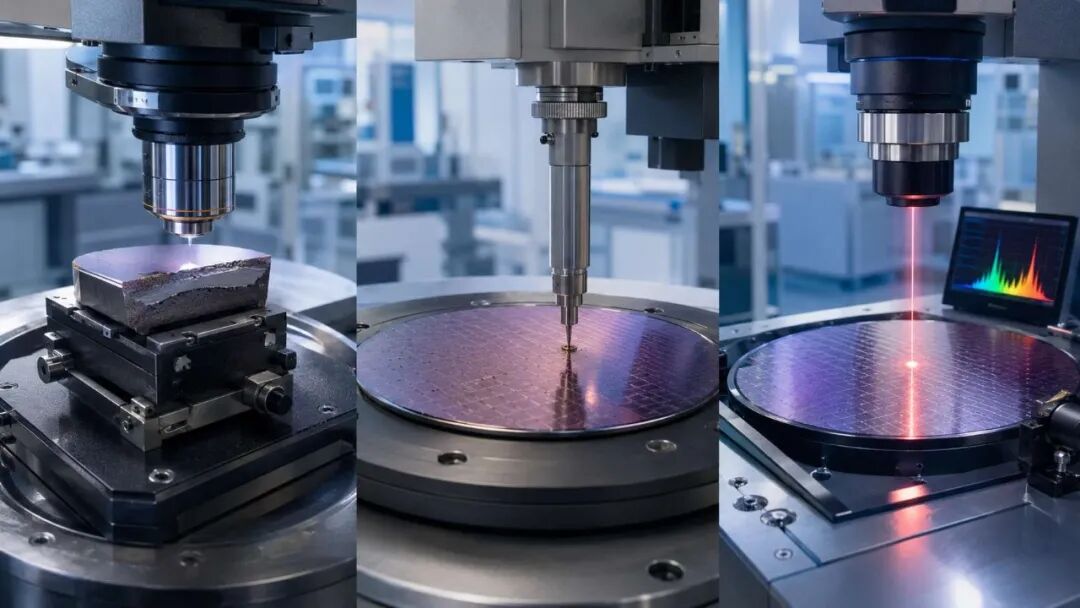
Throughout the whole process, the wafer is never cut, and no probe ever touches the measurement area.
This makes it especially suitable for:
R&D testing, incoming inspection, thinning process monitoring, and multi-point Mapping.
05 | Measuring Only One Point Is Not Enough
For a wafer, a single thickness number is often just the beginning of the story.
For example, after a wafer has been thinned, ground, or polished:
A center region at 350 μm does not mean the edge is also 350 μm.
What truly reflects the process state is:
the thickness distribution across the whole wafer.
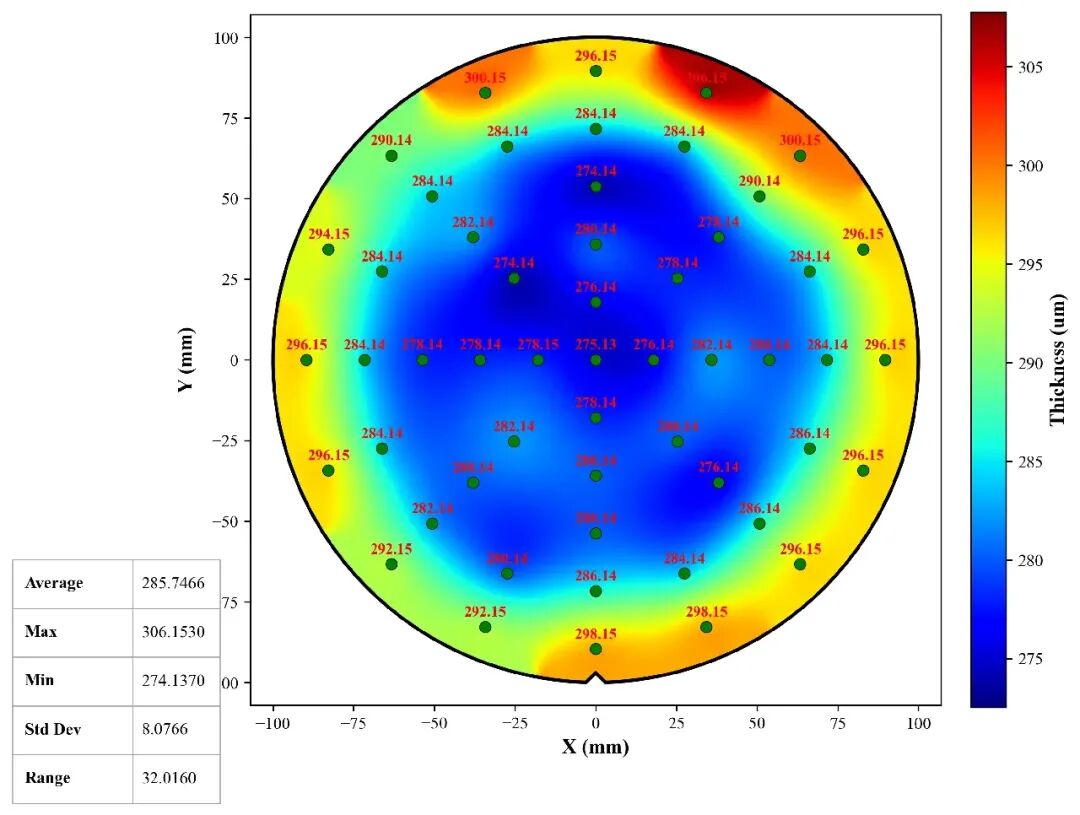
With an automated stage acquiring spectra at preset positions in sequence, you can obtain thickness results at dozens or more locations, and further generate a 2D Thickness Mapping.
That way, differences once buried in number tables become very intuitive:
Where is it too thick?
Where is it too thin?
Is there a center-to-edge trend?
Is there obvious asymmetry between different directions?
One Mapping image often reveals problems more readily than dozens of thickness numbers.
06 | Mapping Tells Us More Than "Average Thickness"
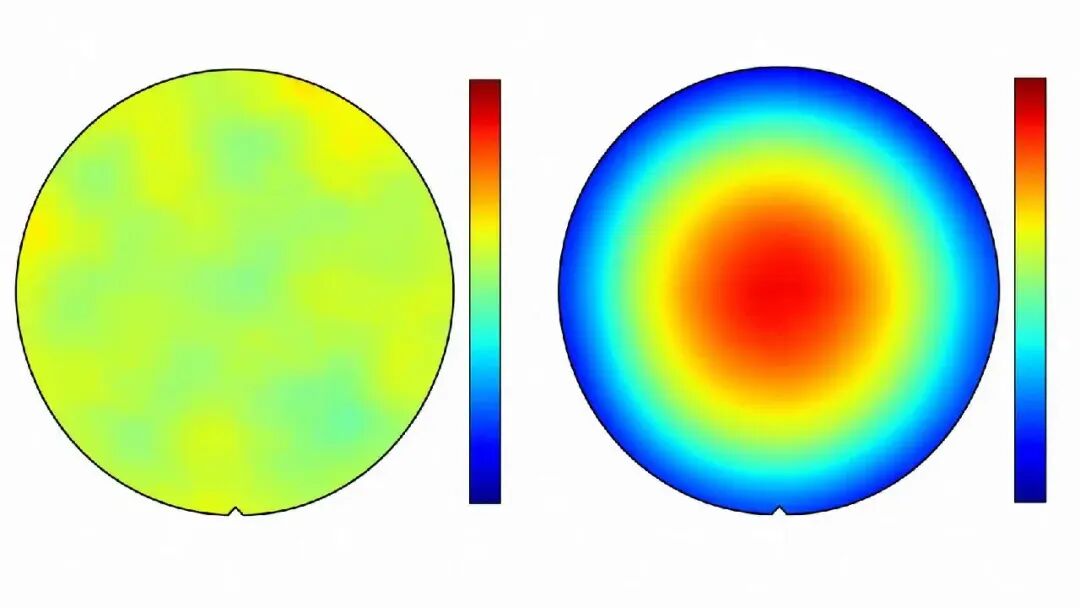
Suppose two InP wafers measure exactly the same average thickness.
Are their process states necessarily the same?
Not necessarily.
The first wafer may be very uniform throughout:
Thickness essentially consistent at the center, the edge, and across different directions.
The second wafer may be:
Markedly thick at the center and thin at the edge — just "coincidentally equal" after averaging.
Judging by average thickness alone, the two wafers seem no different.
But in the 2D Mapping, the two states are obvious at a glance.
Therefore, for wafer thinning and polishing processes, beyond average thickness, you can further watch:
the maximum, minimum, range, standard deviation, CV, and the center-to-edge thickness trend.
From "measuring one thickness," it upgrades further to "observing a process."
That is where Mapping truly earns its value.
07 | Real Measurement Is Not Just "Running an FFT Once"
Having read this far, you might think:
"Since the spectrum has a periodicity, just run an FFT to find the frequency — isn't that enough?"
In principle, nothing is wrong with that.
But real samples are usually far more complex than theoretical models.
InP's refractive index varies with wavelength; different wafers may also differ in surface state, doping, roughness, and measurement signal-to-noise ratio. Public optical-constant data itself shows that InP's refractive index and extinction coefficient have clear wavelength dependence.
Therefore, reliable thickness analysis cannot look only at "whether there is a periodicity"; it must also take a comprehensive view of:
the measurement band, the material's optical constants, the spectral signal-to-noise ratio, and the consistency between the theoretical model and the measured spectrum.
That is why real engineering measurement must consider hardware, spectrum, and algorithm together.
08 | From One Spectrum to One Wafer
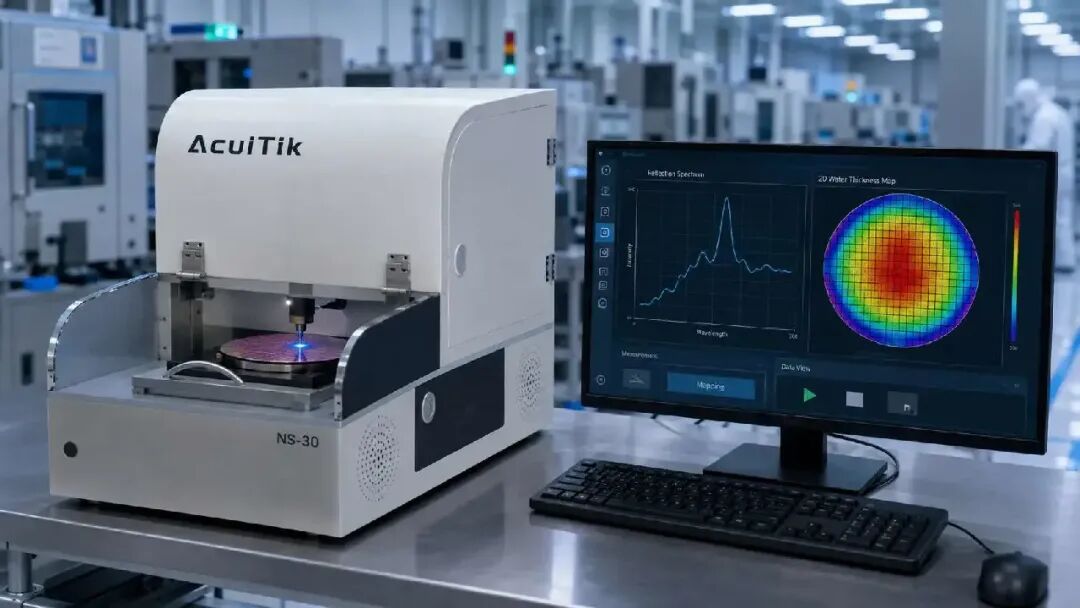
Based on spectral reflectance measurement technology, Acuitik provides non-contact thickness measurement for InP and other semiconductor materials.
The whole process can be very simple:
Place the wafer → acquire the spectrum → automatic analysis → thickness output.
Combined with an automated Mapping platform, it can also scan the whole wafer at preset positions and output:
- single-point thickness;
- average thickness;
- maximum / minimum values;
- standard deviation and CV;
- 2D Thickness Mapping;
- in-plane thickness variation trends across the wafer.
For wafer thinning, grinding, and polishing processes, the meaning of measurement is therefore no longer just:
"How thick is this InP wafer?"
but goes further to answer:
"Is it uniformly thick?"
"Has the process drifted?"
"Will the next wafer repeat the same problem?"
Closing | Let the Spectrum Tell Us How Thick the Wafer Really Is
An ordinary-looking reflectance spectrum actually records the whole journey of light propagating, reflecting, and interfering inside the material.
And the thickness hides among those peaks and valleys.
For InP wafers, using spectral reflectance signals in a suitable band, thickness information can be obtained without sectioning or touching the sample, and multi-point Mapping can further reveal the thickness uniformity of the whole wafer.
From one thickness number to one wafer Mapping.
From judging "did it reach the target thickness" to further observing "is the process stable."
Let measurement tell us not only the result, but also help us see the process.