Film thickness measurement is not simply "spectra in, thickness out."
Truly reliable film thickness results come from an accurate optical model, stable reflectance data, sound fitting judgment, and an understanding of the sample's true state.
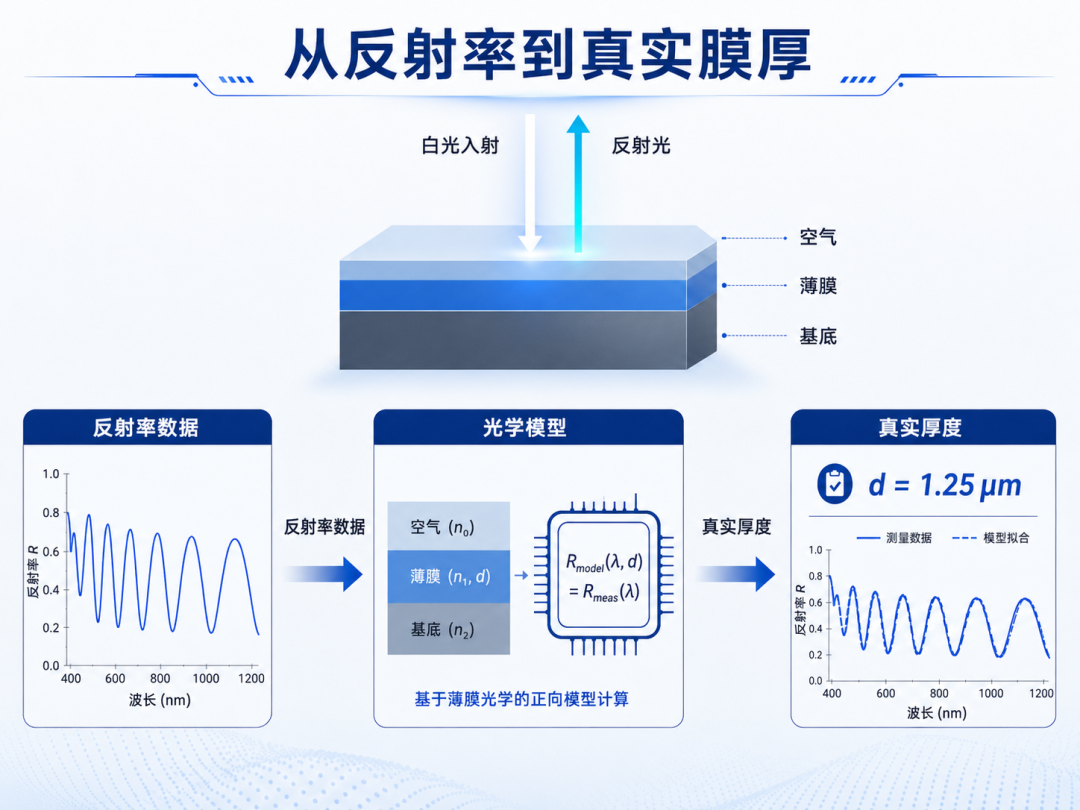
Figure 1 | The core of reflectance-based film thickness measurement is extracting thin-film interference information from the reflectance spectrum and inverting it through a physical model to obtain the true film thickness.
Opening: Is the Thickness the Instrument Reports Actually Real?
In thin-film measurement, many customers care about one question:
Is the thickness the instrument reports actually real?
Especially for semiconductor films, optical coatings, functional materials, diamond films, transparent coatings, and advanced packaging materials, film thickness often directly affects product performance, process stability, and quality judgment.
But a film thickness gauge cannot know the thickness by "glancing at the sample."
The essence of reflectance-based film thickness measurement is to shine light onto the sample surface, collect the reflectance curve across different wavelengths, and then use a thin-film optical model to invert the film thickness from the reflectance data.
In other words, what the instrument truly measures is:
The reflectance spectrum.
And what the customer truly wants is:
True film thickness.
Between reflectance and film thickness lies a complete physical inversion process.
That is also why, on some samples, the film thickness results are very stable and very accurate; while on other samples, the measurement results fluctuate, or even yield untrustworthy thickness values.
Starting from the fundamentals of reflectance-based film thickness measurement, this article explains:
- Why the material's refractive index and extinction coefficient are so important?
- Why micron-scale thick films can be judged through FFT?
- Why nanometer-scale thin films rely more on reflectance fitting?
- Why rough samples make results more complicated?
- How to judge whether a film thickness result is trustworthy or not?
- What problems can our film thickness measurement solution solve for customers?
When a beam of white light strikes a thin-film sample, the light does not reflect only at the topmost surface.
For transparent or semi-transparent films, part of the light reflects at the film's top surface, while another part enters the film and reflects again at the film–substrate interface.
When these reflected beams recombine, they interfere.
As different wavelengths are constructively or destructively reinforced, the reflectance curve shows periodic undulations.
This is what we commonly call:
The thin-film interference signal.
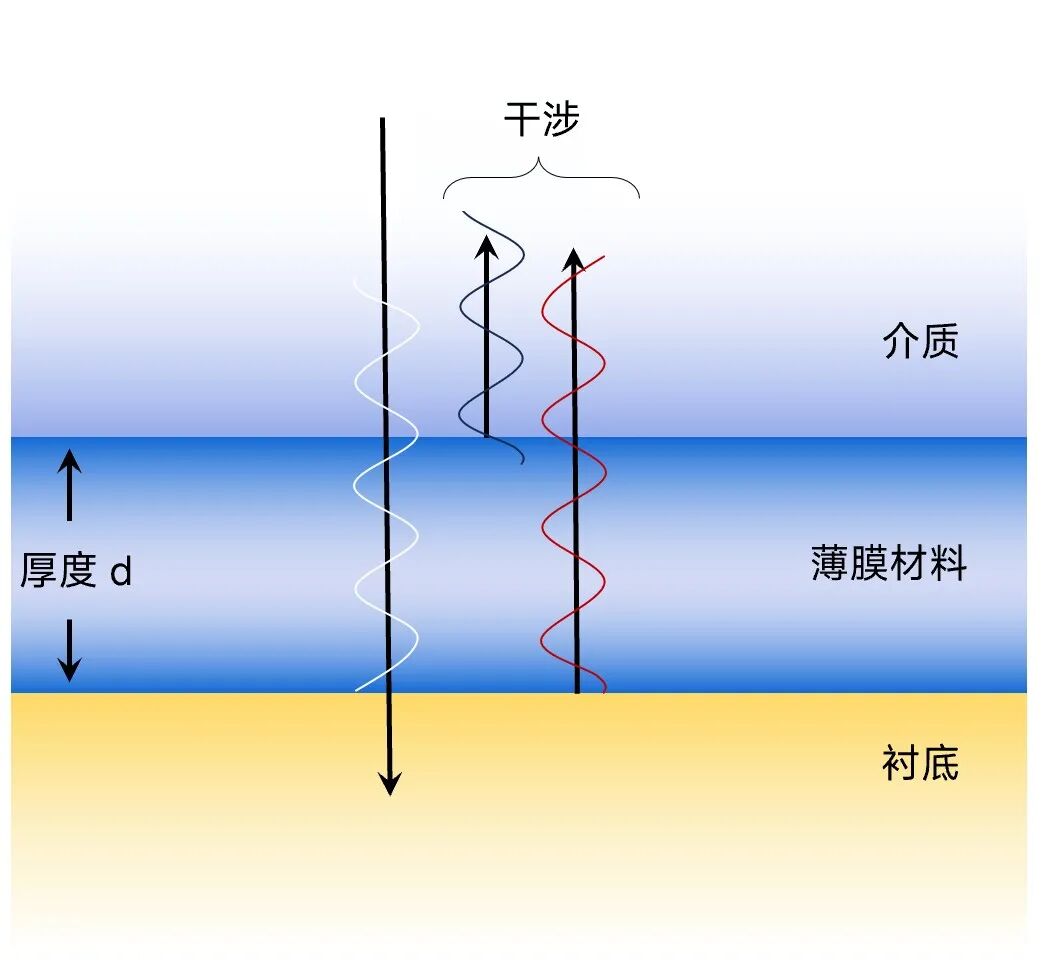
Figure 2 | Incident light reflects multiple times at the film's top surface and at the film–substrate interface; the phase differences among the reflected beams form the interference signal.
The thicker the film, the larger the optical path difference of light traveling in the film, and the more pronounced and denser the interference oscillations in the reflectance curve.
The thinner the film, the smaller the optical path difference, the fewer oscillation peaks in the reflectance curve — sometimes only a relatively slow spectral variation remains.
The reflectance curve therefore actually contains film thickness information.
The core of film thickness measurement is converting these spectral changes into true thickness.
Reflectance-based film thickness measurement is not merely hunting for peaks and valleys in the curve.
True film thickness inversion requires building a thin-film optical model.
For a simple single-layer film structure, it can be written as:
Air / Film / Substrate
For example:
Air / SiO₂ / Silicon
Air / Photoresist / Silicon
Air / Coating / Copper
Air / Diamond / Silicon
In this model, the software needs to know the optical parameters of each layer, especially:
| Parameter | Meaning | Impact on film thickness inversion |
|---|---|---|
| Refractive index n | Determines the speed of light in the material and the phase change | Affects interference peak positions and optical thickness |
| Extinction coefficient k | Describes the material's ability to absorb light | Affects reflectance magnitude and curve shape |
These two parameters are collectively called:
Optical constants, n and k.
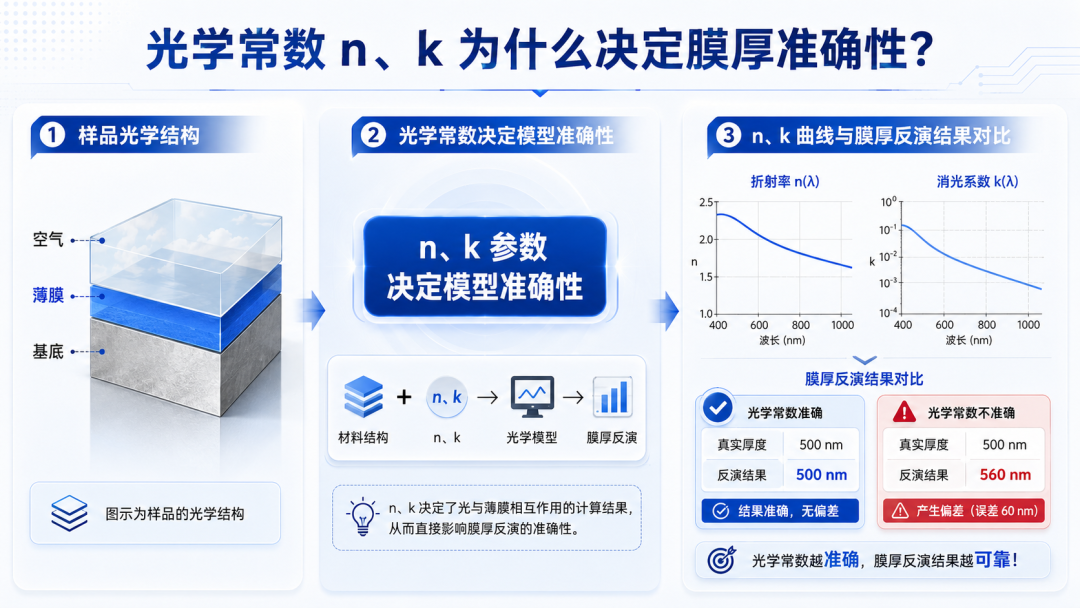
Figure 3 | Inverting film thickness from reflectance necessarily depends on the material's refractive index n and extinction coefficient k. If the optical constants are inaccurate, the computed thickness will also deviate.
Why are n and k so important?
Because the reflectance curve is not determined by thickness alone.
It is simultaneously affected by:
- film thickness
- film refractive index n
- film extinction coefficient k
- substrate material optical constants
- wavelength range
- angle of incidence
- surface roughness
- interface quality between layers
- whether multilayer structures exist
- whether the measured spectrum is stable
Among these, the film thickness is strongly coupled with n and k.
If the material's n and k are inaccurate, the software may still find a theoretical curve that "looks like it fits," but the resulting thickness may already have deviated from the true value.
This is the root of many film thickness measurement errors.
A simple example makes this clear.
The core of thin-film interference relates to the optical path difference, which roughly corresponds to this quantity:
Optical thickness = n × d
where:
- n is the film's refractive index
- d is the film's physical thickness
What the film thickness gauge ultimately wants is d — the true physical thickness.
But what the reflectance curve directly reveals is usually the optical thickness jointly determined by n and d.
If n is set too high, the software may return a smaller d. If n is set too low, the software may return a larger d.
So we arrive at a crucial conclusion:
With inaccurate optical constants, film thickness results can never be truly accurate.
Especially for unknown materials, composite materials, absorbing materials, rough films, and samples with highly variable process conditions, fixed n and k values from a database cannot simply be applied.
Database parameters are reference values only.
A truly reliable approach usually needs to combine:
- calibration standards
- samples of known thickness
- ellipsometry or cross-sectional SEM calibration
- reflectance data across multiple batches
- process experience
- reasonable model constraints
to refine the material's n and k parameters.
Once this step is done well, reflectance-based film thickness inversion has a reliable foundation.
When the film thickness reaches the micron scale, the reflectance curve usually shows pronounced periodic oscillations.
These oscillations come from interference between the light reflected at the film's top and bottom interfaces.
For micron-scale thick films, the reflectance curve contains many peaks and valleys, and the periodic information is relatively rich.
At this point, besides direct physical model fitting, the FFT method can also be used to extract the dominant frequency components and thereby estimate the film thickness.
The role of FFT can be understood simply as:
Converting the periodic oscillations in the reflectance curve into thickness-related peaks.
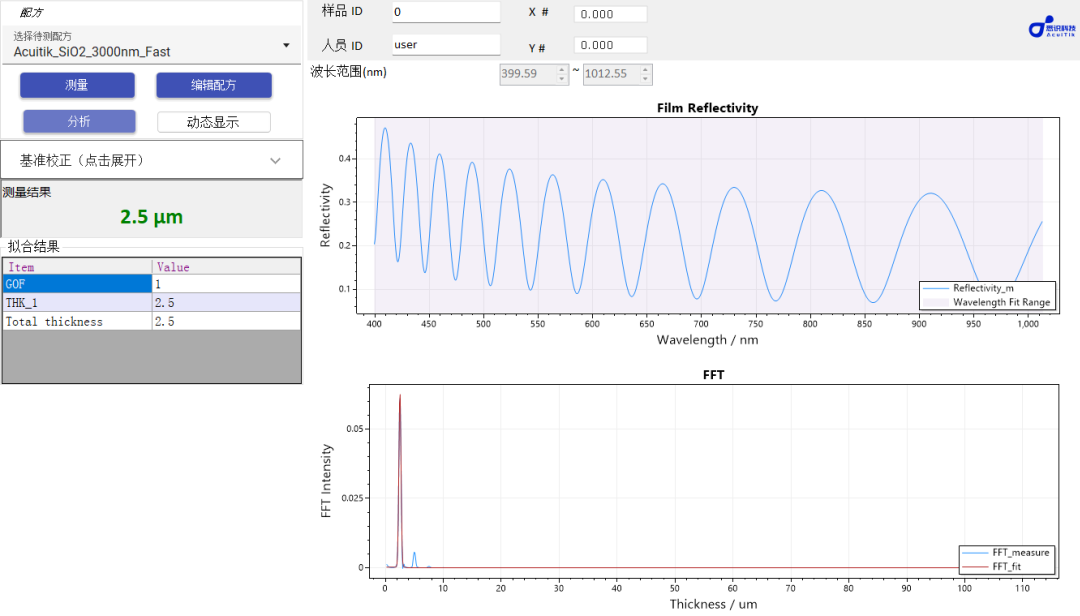
Figure 4 | Micron-scale thick films usually show clear reflectance oscillation signals; after FFT a distinct main peak appears, and the main peak position corresponds to the primary film thickness information.
If the reflectance curve quality is good, the FFT result usually contains a very distinct main peak.
That main peak can be mapped to the sample's true thickness.
This kind of situation generally indicates:
- a stable interference signal exists in the reflectance curve
- the film has relatively clear top and bottom interfaces
- the sample's roughness is within an acceptable range
- the spectral signal-to-noise ratio is high
- the thickness result has high trustworthiness
For micron-scale thick films, FFT is therefore a very intuitive diagnostic tool.
It not only helps obtain the thickness, but also helps judge whether the result is trustworthy.
Not every reflectance curve is suitable for FFT analysis.
If the measured reflectance curve is a pile of jumbled signals without obvious periodic oscillation, the FFT will often show many peaks, and these peaks have no clear hierarchy among them.
Even in this situation, the software may still output a thickness value.
But that thickness value does not necessarily have physical meaning.
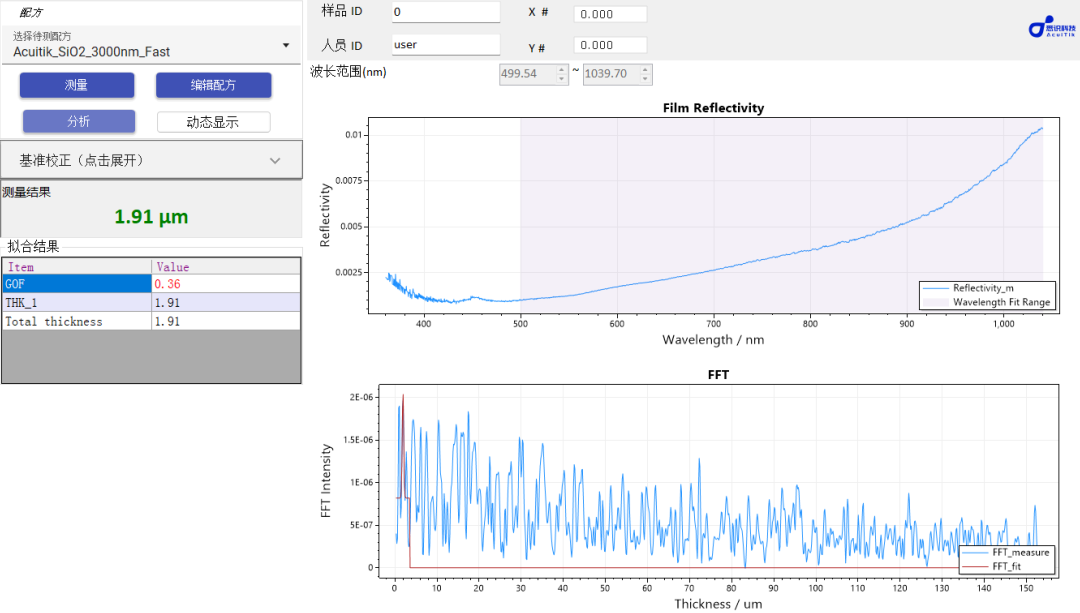
Figure 5 | When the reflectance curve lacks a stable periodic signal, the FFT result shows multiple scattered peak positions. Without a clear main peak, the film thickness result is usually untrustworthy.
A reliable FFT thickness result should at least satisfy:
- the reflectance curve shows recognizable periodic oscillation
- a distinct main peak exists in the FFT
- the main peak strength clearly exceeds the background noise
- the main peak position falls within a reasonable thickness range
- repeated measurement results are stable
- it is basically consistent with the sample's process expectations
If the FFT peaks are numerous, messy, and without a clear main peak, it means the effective interference signal in the reflectance curve is weak, with noise, scattering, roughness, or other non-ideal factors dominating.
Thickness values obtained this way should be treated with caution.
Simply put:
**FFT is not magic.
It can only extract thickness information from regular oscillations — it cannot conjure true film thickness out of completely chaotic signals.**
When the film thickness is at the nanometer scale, the reflectance curve usually contains few oscillation peaks.
Sometimes, within the limited wavelength range, not even one complete oscillation period is visible.
At this point, the FFT method is often no longer suitable as the primary means of judgment.
For nanometer-scale thin films, the more commonly used method is reflectance fitting based on a thin-film optical model.
That is, the software repeatedly adjusts the film thickness parameter, computes the theoretical reflectance curve, and compares it with the measured reflectance curve.
When the theoretical curve and the measured curve overlap closely, a fitted film thickness is obtained.
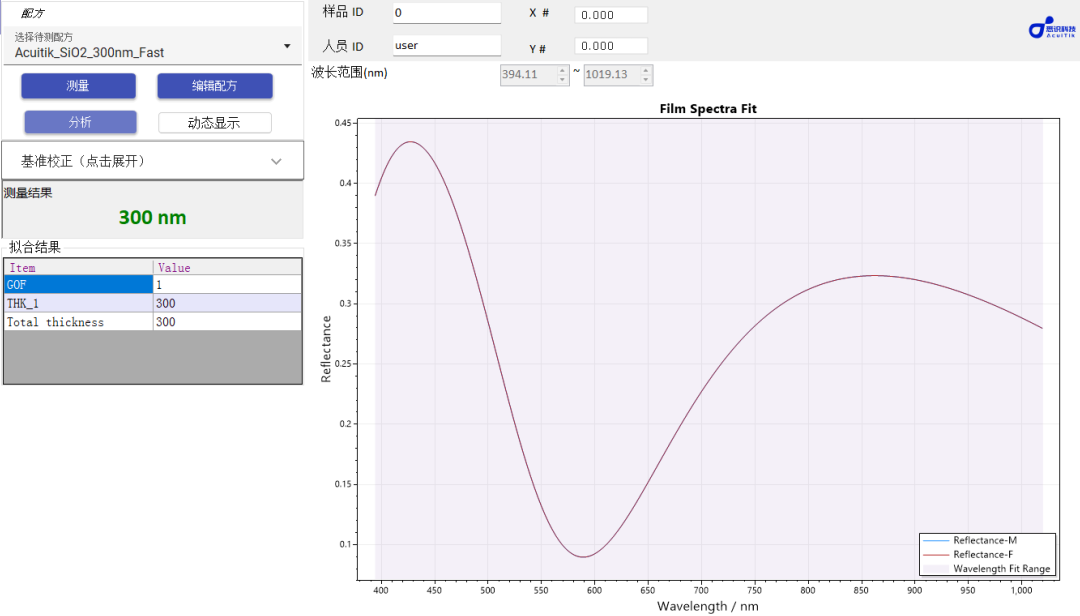
Figure 6 | Nanometer-scale films show few reflectance oscillation peaks; thickness is usually inferred by fitting the theoretical reflectance curve to the measured curve.
For nanometer-scale thin films, judging whether the result is trustworthy cannot rest on the thickness value the software outputs alone.
What matters more is the fitting quality.
A trustworthy fitting result should generally satisfy:
- measured and theoretical curves overlap highly overall
- no obvious peak-position shifts
- consistent peak-and-valley trends
- residuals are small and show no obvious systematic bias
- the fitted thickness falls within a reasonable process range
- repeated measurement results are stable
If the peak positions of the fitted and measured curves shift obviously, the model is not correctly explaining the real sample.
In that case, even if the software gives a thickness value, do not blindly trust it.
Here is a very important question:
A good fit does not necessarily mean the thickness is true.
For some complex samples, "a wrong model can still fit locally" can occur.
For example:
- film n and k set incorrectly
- the sample is actually a multilayer structure, but the model was set up as a single layer
- a rough surface layer exists, but the model ignores roughness
- the substrate reflectance is inconsistent with the model
- oxide layers, contamination layers, or transition layers are present
- the material's optical constants vary with process
- bias exists in spectral normalization or baseline calibration
In these situations, the theoretical curve may look fairly close to the measured curve in certain bands, yet the resulting film thickness can still be biased.
So when judging film thickness results, you cannot rely on a single fit score alone — you need to assess comprehensively:
| Judgment dimension | Questions to check |
|---|---|
| Thickness plausibility | Is it consistent with process expectations and the sample's range? |
| Peak-position match | Do the theoretical and measured curve peak positions agree? |
| Residual pattern | Are the residuals random, or is there systematic bias? |
| Model structure | Does it match the real sample structure? |
| n and k parameters | Have they been calibrated or verified? |
| Repeated measurement | Are multiple measurements stable? |
| Process trend | Is it consistent with deposition time and process parameter changes? |
Truly reliable film thickness results come from the agreement of spectrum, model, and process.
In reflectance fitting, a very intuitive check is to look at peak positions.
If the theoretical and measured curves' peak positions essentially agree, the optical thickness in the model is fairly reasonable.
If the peak positions shift obviously, at least one key parameter in the model is incorrect.
Common causes include:
- incorrect film thickness
- incorrect refractive index n
- incorrect extinction coefficient k
- wrong substrate material setting
- extra thin layers in the actual sample
- bias in wavelength calibration
- roughness altering the coherent interference signal
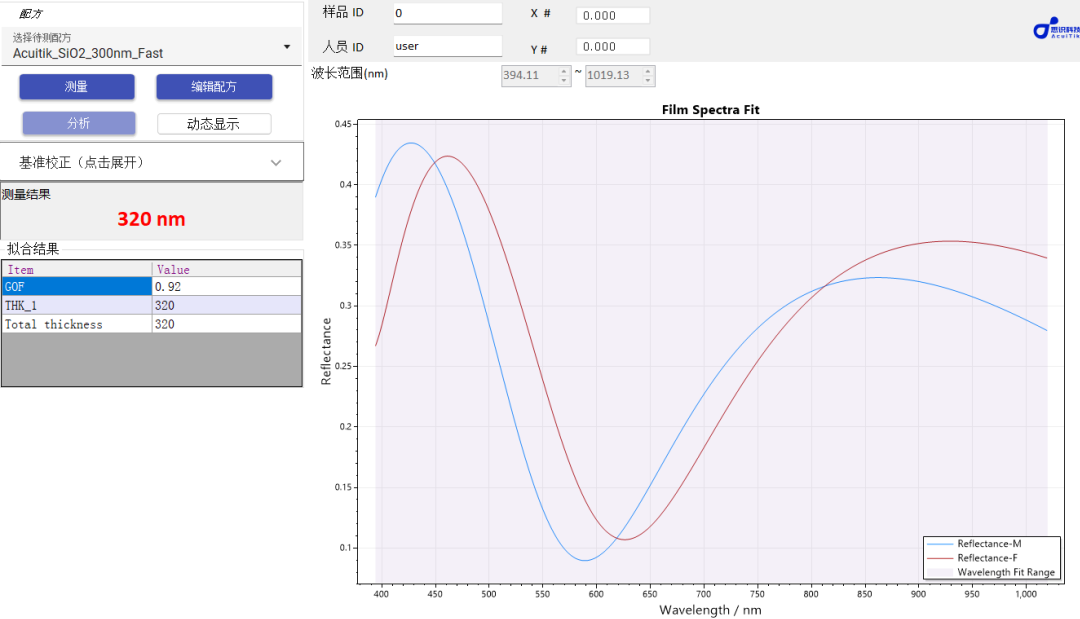
Figure 7 | If the peak positions of the theoretical and measured curves shift obviously, the current model cannot accurately explain the sample, and the film thickness result needs careful judgment.
Therefore, in actual measurement, we strongly advise customers not to look only at the final thickness value, but also at the reflectance fitting plot.
A reliable result should be:
A plausible thickness number and a plausible curve fit.
Ideal thin-film samples usually have flat surfaces and clear interfaces.
But in real processes, many samples are not ideal.
For example:
- rough diamond film surfaces
- non-uniform spray coating surfaces
- particles on electroplated layer surfaces
- uneven surfaces after etching or oxidation
- grain structure in polycrystalline materials
- scattering and diffuse reflection in thick film materials
When the sample surface is relatively rough, the incident light scatters.
The specular reflection that should return stably to the detector weakens, and the interference signal in the reflectance curve is disturbed.
At this point, the reflectance curve may show increased noise, weakened oscillation, and stronger local fluctuations.
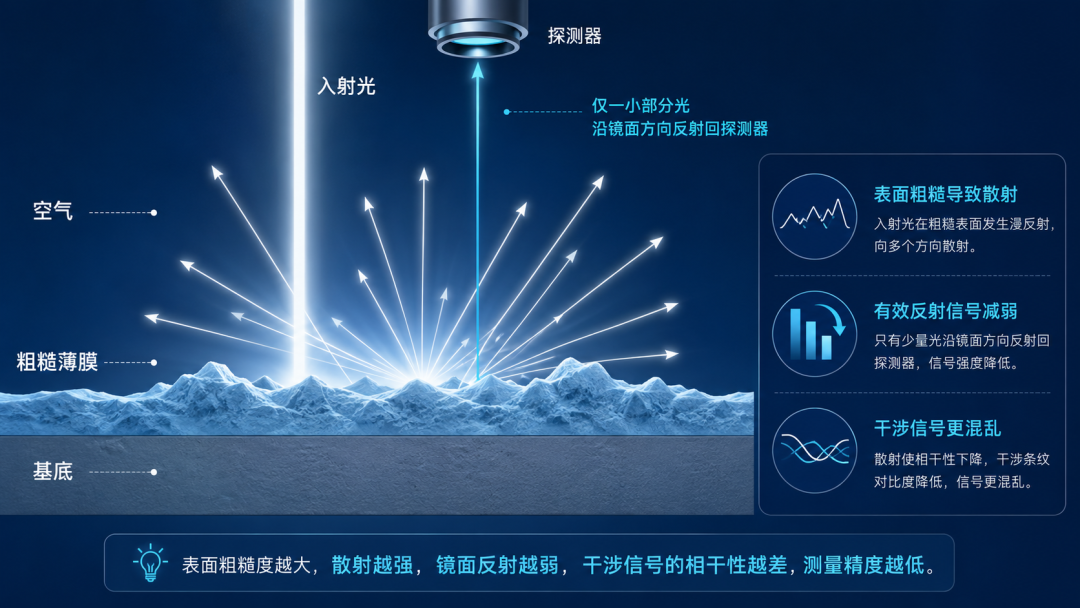
Figure 8 | Surface roughness causes light to scatter, weakening the effective reflection signal and making the interference curve messier, which undermines the reliability of film thickness inversion.
But rough does not necessarily mean unmeasurable.
The key is whether the roughness has already destroyed the main interference signal.
For micron-scale thick films, if the sample surface has some roughness, the reflectance curve may become less clean than an ideal sample's.
The FFT result may also show some stray peaks.
But if clear effective interference signals still exist inside the sample, the FFT will usually still show a distinct main peak.
That main peak usually corresponds to the sample's primary thickness information.
In this situation, although the curve is not perfect, the thickness can still carry reference value, and can even be fairly accurate.
The key checks are:
- whether a distinct main peak exists in the FFT
- whether the main peak is stable
- whether the main peak position is consistent across repeated measurements
- whether the main-peak thickness matches process expectations
- whether the stray peaks are clearly below the main peak
- whether the results at different positions show a reasonable spatial distribution
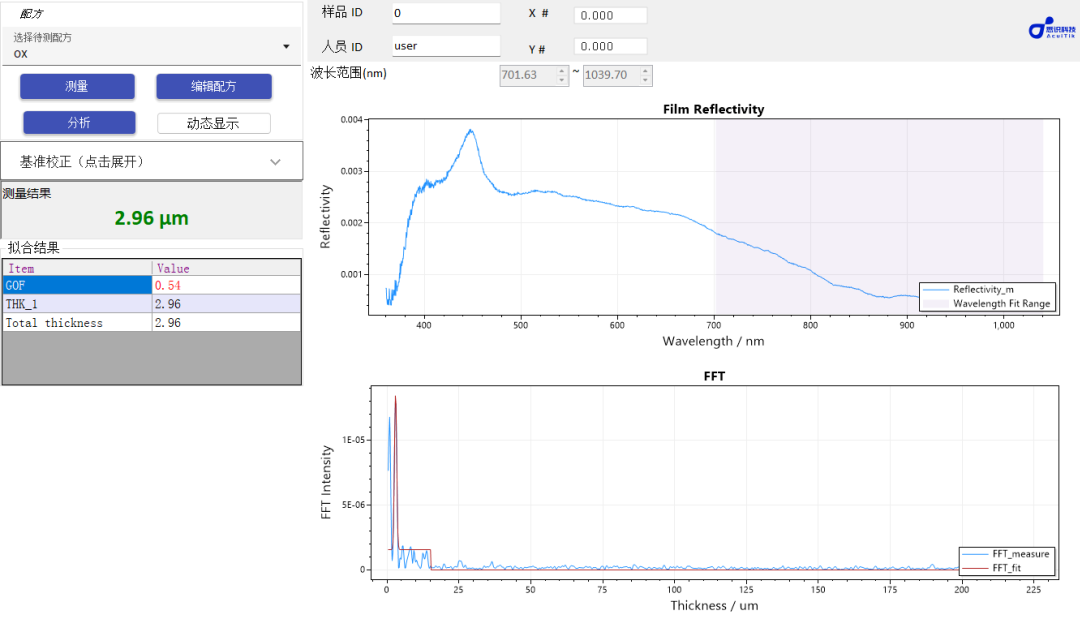
Figure 9 | When roughness is within an acceptable range, stray FFT peaks may appear, but if a stable clear main peak remains, the main peak position still reflects the true film thickness.
For such samples, the point is not to pursue an absolutely perfect reflectance curve, but to judge whether the main interference information still exists.
When the sample roughness is very large, the situation is different.
At this point, a large share of the incident light is scattered into different directions, and the effective specular reflection returning to the detector drops sharply.
The reflectance curve may become a highly jumbled signal.
The FFT result also shows large numbers of irregular peak positions, with no clear main peak.
In this situation, even if the software outputs a film thickness value, it is very likely untrustworthy.
Because the signal the instrument receives is no longer mainly coherent interference from the film's top and bottom interfaces, but a mixture of scattering, noise, local structural differences, and surface topography effects.
Simply put:
When the sample surface is too rough and the reflectance curve has lost its effective interference features, reflectance-based film thickness measurement no longer has a reliable basis for inversion.
At this point, consider:
- changing the measurement position
- adding multi-point Mapping
- choosing a flatter surface region
- building an empirical calibration using calibration standards
- reducing the effective measurement area
- verifying with microscopy, SEM, stylus profilometry, or other methods
- using a measurement model better suited to rough samples
Beyond the sample itself, the quality of the reflectance data is also extremely important.
If the reflectance data is inaccurate, even the best downstream model will struggle to yield true film thickness.
Common influencing factors include:
| Factor | Possible problem |
|---|---|
| Inaccurate reference spectrum | Overall reflectance offset or distortion |
| Unstable light source | Curve fluctuations not caused by the sample itself |
| Sample placement angle change | Changed reflection strength and spectral shape |
| Wavelength calibration error | Peak-position shifts between theoretical and measured curves |
| Surface contamination | Reflectance changes, model mismatch |
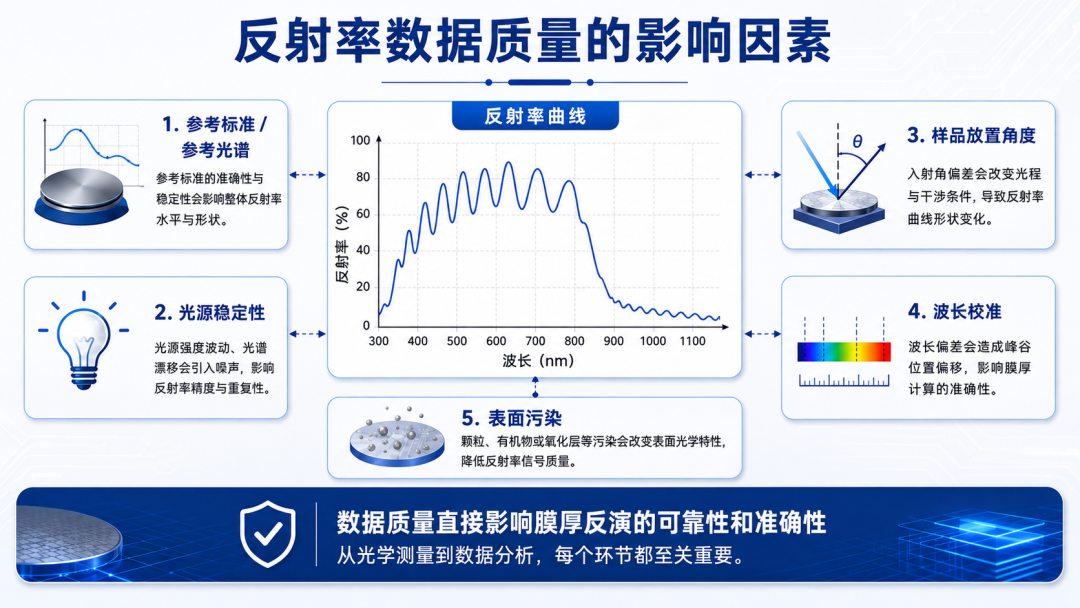
Figure 10 | Reflectance data quality is affected by the reference spectrum, light source stability, sample placement, wavelength calibration, and surface contamination.
Reliable film thickness measurement therefore needs not only good algorithms, but also a stable optical system and disciplined measurement procedures.
When using a film thickness gauge, customers can judge the trustworthiness of results along the following dimensions.
13.1 Micron-Scale Thick Films: What to Check?
- Does the reflectance curve show obvious periodic oscillation?
- Does the FFT have a clear main peak?
- Is the main peak clearly above the background?
- Is the main peak position stable across repeated measurements?
- Is the thickness consistent with process expectations?
- Does multi-point Mapping show a reasonable distribution?
If the reflectance curve is jumbled and the FFT has no main peak, the thickness result needs caution.
13.2 Nanometer-Scale Thin Films: What to Check?
- Do the theoretical and measured curves overlap highly?
- Do the peak positions match?
- Are the peak-and-valley trends consistent?
- Are the residuals small and free of systematic bias?
- Are n and k reliable?
- Does the model structure match the real sample?
- Are repeated measurements stable?
If the peak positions shift obviously and the fitted curve cannot explain the measured curve, the thickness result is untrustworthy.
13.3 Rough Samples: What to Check?
- Do effective interference features still exist in the reflectance curve?
- Does the FFT still have a stable main peak?
- Are the stray peaks clearly below the main peak?
- Do the results at different positions match the sample's true distribution?
- Is Mapping or calibration needed?
- Should other methods be used for verification?
If the roughness is so large that the reflectance curve is completely jumbled, you should not force yourself to trust a single-point thickness value.
Film thickness measurement is not simple software arithmetic.
It requires three things to hold simultaneously:
High-quality reflectance data
+
An accurate optical model
+
Sound process-experience judgment
=
Trustworthy film thickness results
If the reflectance data quality is poor, the results are untrustworthy. If the n and k parameters are inaccurate, the results will be biased. If the model structure is inconsistent with the real sample, the fit may be distorted. If the sample is too rough, the interference signal may be destroyed. If you look only at the thickness number and ignore the curve and the FFT, misjudgment is easy.
Therefore, we always advise customers that when performing film thickness measurement, they should not focus only on the final thickness value output.
They should pay closer attention to:
- the raw reflectance curve
- the theoretical fitted curve
- the FFT main peak
- the fitting residuals
- GOF, or goodness of fit
- repeatability stability
- multi-point Mapping distribution
- consistency with process conditions
Only then is the film thickness result data with real engineering value.
Our reflectance-based film thickness measurement solution does not just output a thickness number — it helps customers judge whether that thickness value is trustworthy.
For different samples, we can provide:
- reflectance curve analysis
- FFT analysis for micron-scale thick films
- fitting analysis for nanometer-scale thin films
- multi-point Mapping thickness distribution
- optical model building
- n and k parameter optimization advice
- measurability assessment for rough samples
- process trend analysis
- batch consistency evaluation
For customers, this means:
Faster Judgment of Whether Samples Meet Specification
Fast non-contact measurement reduces destructive testing and improves R&D and production efficiency.
Clearer Understanding of Process Changes
The reflectance curve, fitted curve, and FFT main peak reveal whether process changes genuinely affect film thickness.
A More Direct View of Spatial Distribution
Multi-point Mapping shows the whole sample's thickness distribution, edge effects, and local anomalies.
More Reliable Product Quality Control
Batch data comparison promptly exposes process drift, equipment fluctuation, and abnormal samples.
A More Scientific Judgment of Result Trustworthiness
We output results, and we also help customers understand why the results are — or are not — trustworthy.
When customers first use a film thickness gauge, many care about only one question:
Can it measure the thickness?
But in real R&D and production, the more important question is actually:
Can it measure the thickness accurately?
And going one step further:
Can it tell whether that thickness value is trustworthy?
That is exactly the crux of reflectance-based film thickness measurement.
A truly valuable film thickness measurement system should help customers answer:
- Is this sample suitable for reflectance measurement?
- Is the current reflectance curve high quality?
- Is the FFT main peak clear?
- Do the fitted and measured curves match?
- Do the n and k parameters need correction?
- Has roughness already affected the measurement?
- Do the measurement results follow the process trend?
- Does the multi-point distribution indicate a stable process?
When all of these questions can be answered, film thickness measurement is no longer just a number — it is a tool that can truly guide the process.
Obtaining true film thickness from reflectance data is, in essence, a physical inversion process.
It depends on optical interference principles, and equally on the material's optical constants, the model setup, signal quality, and the sample's state.
For micron-scale thick films, clear reflectance oscillation and a distinct FFT main peak are important evidence for judging thickness trustworthiness.
For nanometer-scale thin films, high-quality reflectance fitting, accurate peak-position matching, and reliable n and k parameters are the keys to accurate thickness.
For rough samples, whether effective interference signals survive determines whether the measurement results are trustworthy.
Film thickness measurement is therefore not a simple "quick measurement" — it means reading the physics behind the reflectance curve.
**True thickness is not just something the software computes.
It comes from reliable data, an accurate model, and a correct understanding of the sample's process.**
Through professional reflectance-based film thickness measurement solutions, we hope to help customers not only measure thickness, but measure it accurately, judge it, and understand the process state behind it.